Configuration
Cassandra
TheHive uses Cassandra for its database. Let’s first edit Cassandra’s configuration file.
nano /etc/cassandra/cassandra.yamlI can customize the listen address, ports, cluster name, and others. I’m making the following modifications:
cluster_name: 'ucch45'listen_address: 192.168.0.170rpc_adress: 192.168.0.170seed_provider: - class_name: org.apache.cassandra.locator.SimpleSeedProvider parameters: - seeds: "192.168.0.170:7000"After saving the file, stop the Cassandra service and remove old files. Then start the service again.
systemctl stop cassandra.servicerm -rf /var/lib/cassandra/*systemctl start cassandra.serviceElasticsearch
TheHive uses Elasticsearch to manage data indices or for querying data. The configuration file for Elasticsearch can be accessed with:
nano /etc/elasticsearch/elasticsearch.ymlI’m making the following modifications:
cluster.name: thehivenode.name: node-1network.host: 192.168.0.170http.port: 9200cluster.initial_master_nodes: ["node-1"]In order to start elastic service it requires either a discovery seed or a cluster initial master node. I’ve removed the “node-2” from initial_master_nodes as I don’t have a second node. The discovery seed is what we need to configure to scale out Elasticsearch. Since I’m only using this as a demo environment, and there’s no need to scale, I’m leaving it as it is.
After saving the file, let’s stop, remove existing data, and start again for the configuration to take effect.
systemctl stop elasticsearchrm -rf /var/lib/elasticsearch/*systemctl start elasticsearchTheHive
First, I need to make sure that TheHive’s user and group has access to the /opt/thp/ file path.
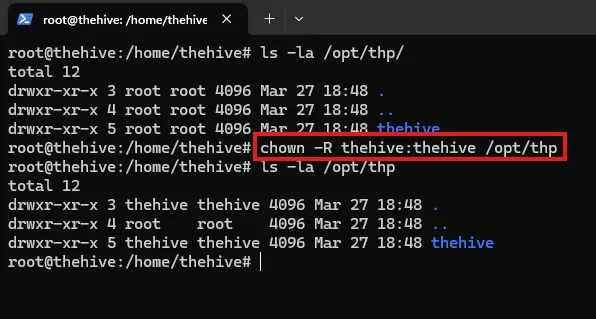
I’ve changed the user and group to thehive.
chown -R thehive:thehive /opt/thpAfter this, I am now ready to edit TheHive’s’ configuration file.
nano /etc/thehive/application.confI am making the following changes to the file.
db.janusgraph {  storage {    backend = cql    hostname = ["192.168.0.170"]    # Cassandra authentication (if configured)    # username = "thehive"    # password = "password"    cql {      cluster-name = ucch45      keyspace = thehive    }  }  index.search {    backend = elasticsearch    hostname = ["192.168.0.170"]    index-name = thehive  }}
# Service configurationapplication.baseUrl = "http://192.168.0.170:9000"
By default, TheHive has Cortex and MISP enabled. Cortex is their data enrichment and response capability. MISP is used as their CTI platform.
After saving the configuration file, I’m going to restart thehive service.
systemctl restart thehivesystemctl status elasticsearchsystemctl status cassandrasystemctl status thehiveAfter making sure that Elasticsearch, Cassandra, and TheHive are running, I am now able to access the TheHive on the designated IP on port 9000.
Wazuh
On the Wazuh server, I need to make sure to obtain the credentials for the administrator user and the Wazuh API user (will be using later to perform responsive capabilities).
Since, I had downloaded Wazuh with using curl, it saved a wazuh-install-files.tar on my home directory. To extract the files, let’s run the below command.
tar -xvf wazuh-install-files.tarAfter the extraction, within the wazuh-install-files/ there should be a wazuh-passwords.txt file that contains the passwords for all users. I’ll save the admin user and the Wazuh API user credentials somewhere safe.
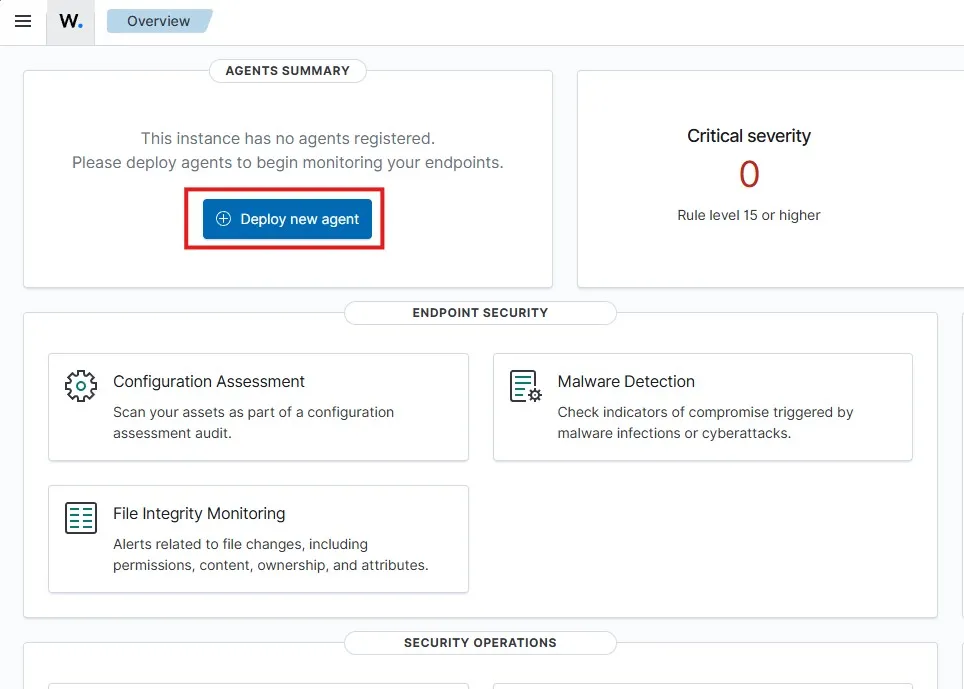
Enroll Windows agent
Let’s go and log in to Wazuh on https://192.168.0.169
Clicking on Deploy new agent
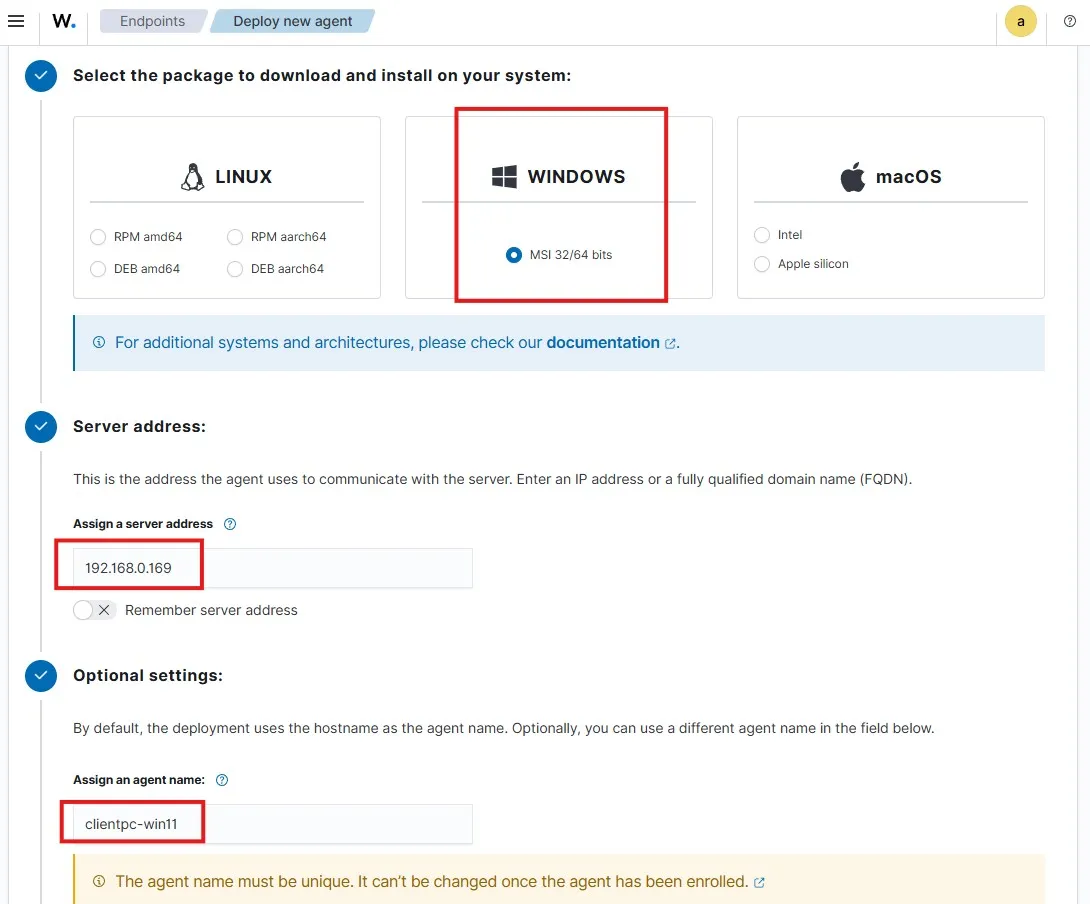
I am selecting Windows as the OS. The server for my Wazuh server is 192.168.0.169 I am assigning an agent name clientpc-win11 and leaving the group to Default
Let’s copy and run the following commands as instructed.
Invoke-WebRequest -Uri https://packages.wazuh.com/4.x/windows/wazuh-agent-4.11.0-1.msi -OutFile $env:tmp\wazuh-agent; msiexec.exe /i $env:tmp\wazuh-agent /q WAZUH_MANAGER='192.168.0.169' WAZUH_AGENT_NAME='clientpc-win11'
NET START WazuhSvc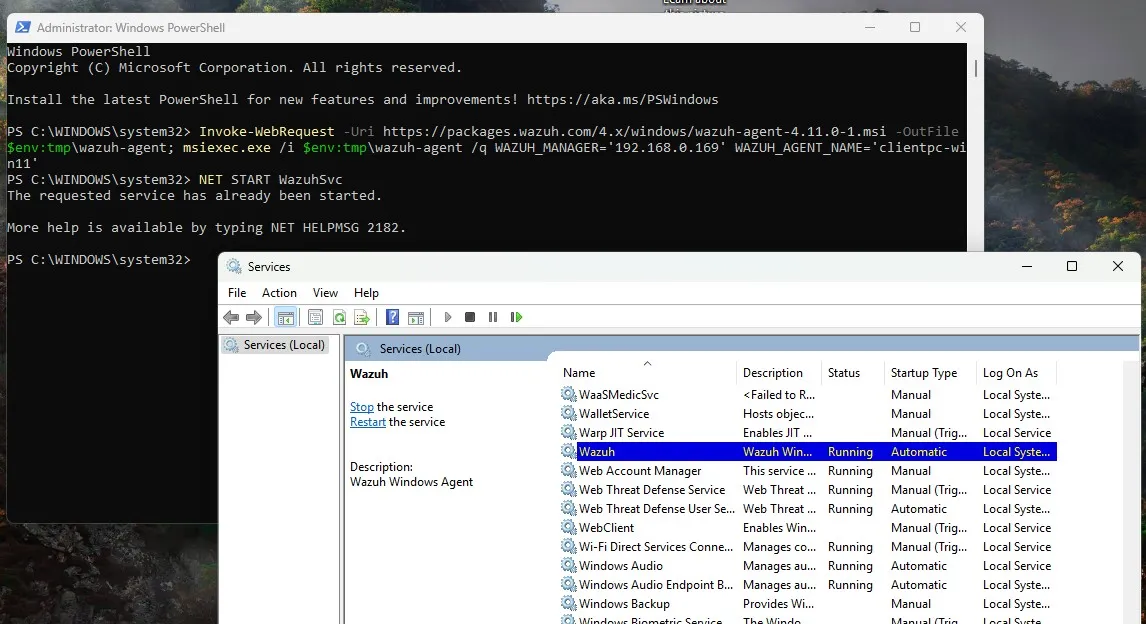
I can see that the Wazuh service is running on the client machine.
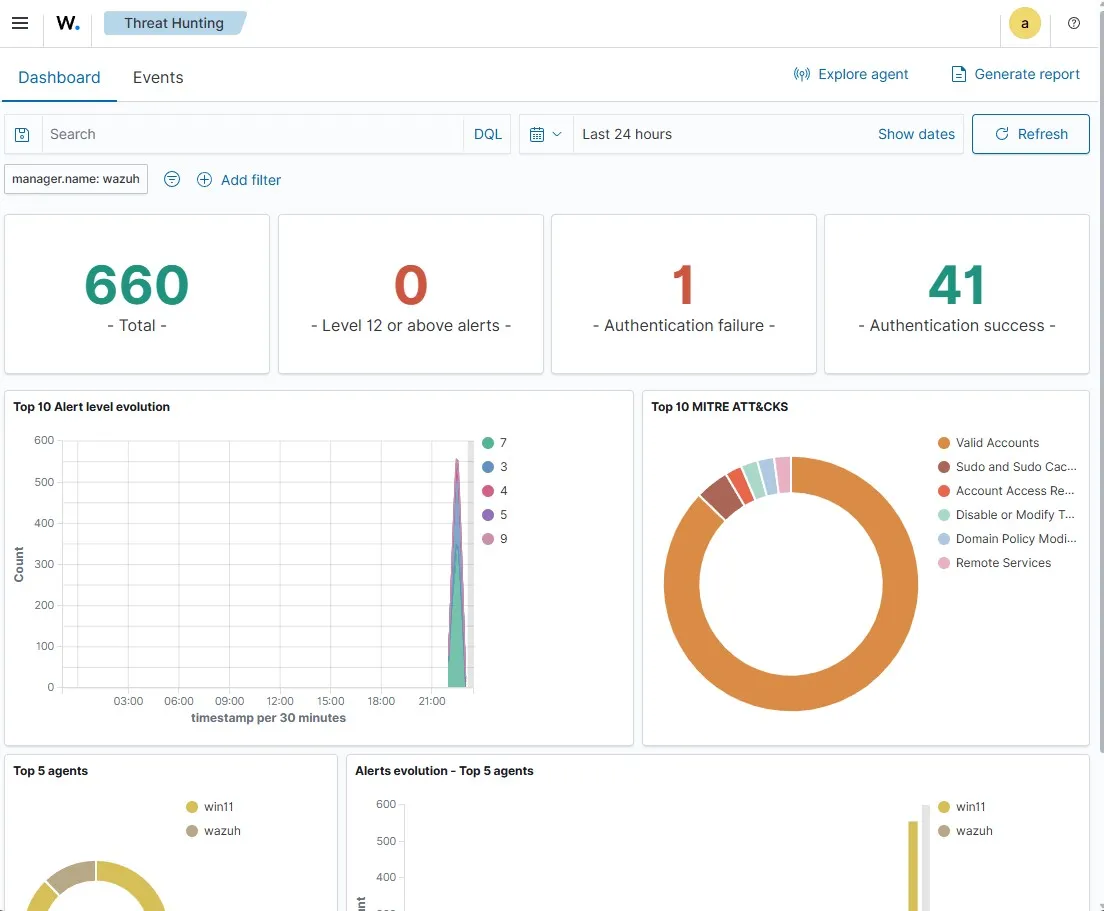
If I go the Threat Hunting section, I can search for events sent from the Windows client.
The end goal here is to detect Mimikatz usage on the Windows client machine. To do that, I’ll need to generate telemetry and create Mimikatz alerts.