Investigate - SSH Brute Force
Objective:
- Learn how to investigate an SSH Brute Force alert
Under Security > Alerts
I can see alerts that get generated here. For a brute force attack, there might be some information that we should look for.
- Is the IP known to perform brute force activity?
- Who are the users affected by this IP?
- Were any of the attempts successful?
- If so, what activity occurred after the successful login?
I am getting alerts with SSH brute force attempts coming from IP 178.215.238.131.
Investigate an IP
IP known to perform brute force?
To answer the first question, I am going to use AbuseIPDB.
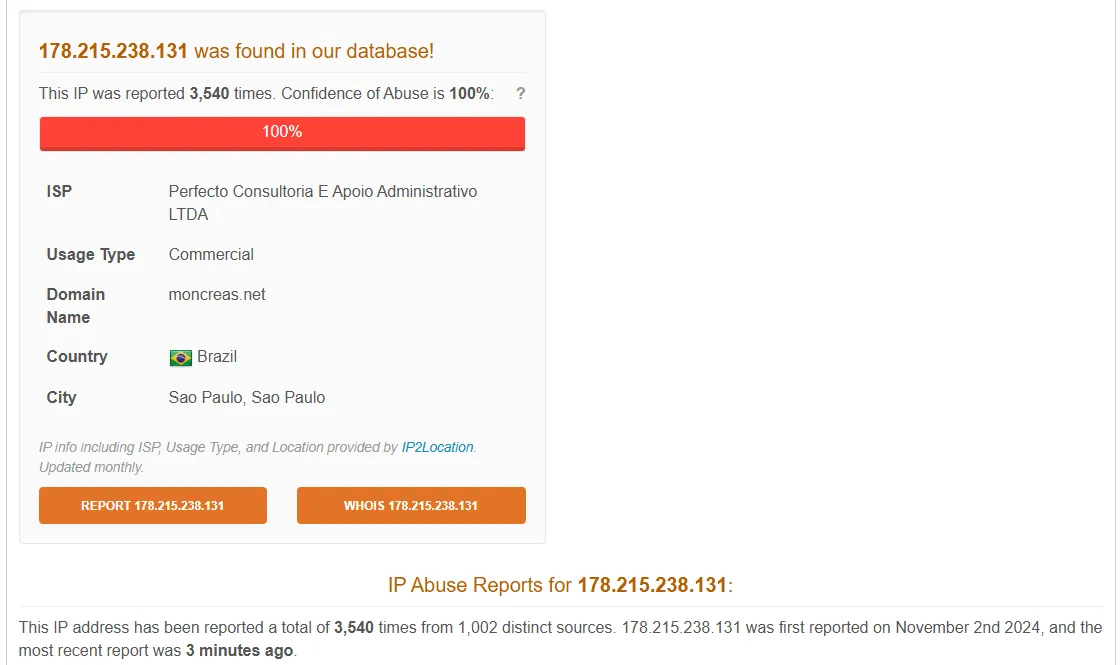
This IP is heavily reported with last report from 3 minutes ago. By scrolling through the report data, I can see a lot of others have reported SSH brute force. I am going to use another resource called Greynoise.
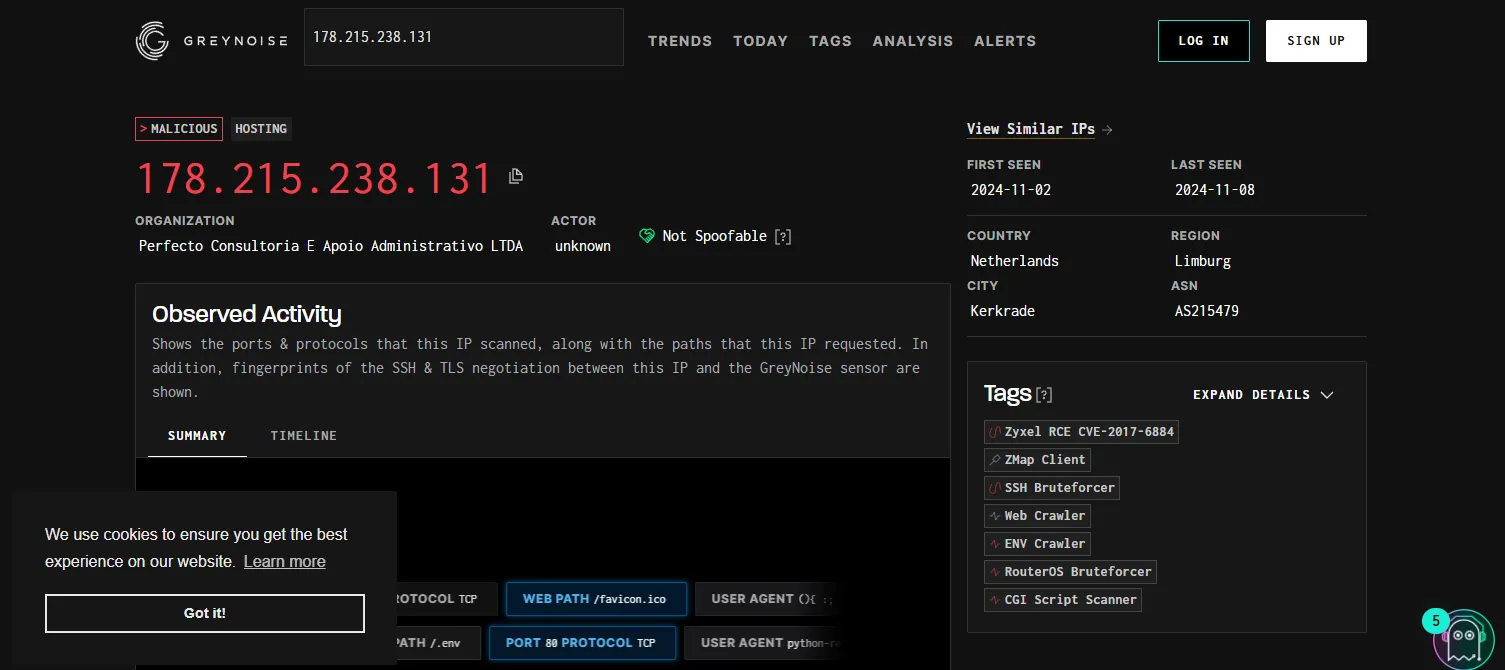
From the results I can see that the IP address of interest is indeed malicious. From the Tags I can see it is tagged as SSH Bruteforcer.
Since this particular IP is known to perform brute force, this might not be a reason for worry. However, if the IP search were to generate clean results, it would’ve been an issue, because the IP could be targeting my machine/service.
Users affected by the IP
I can search the IP from the Elastic Discover.
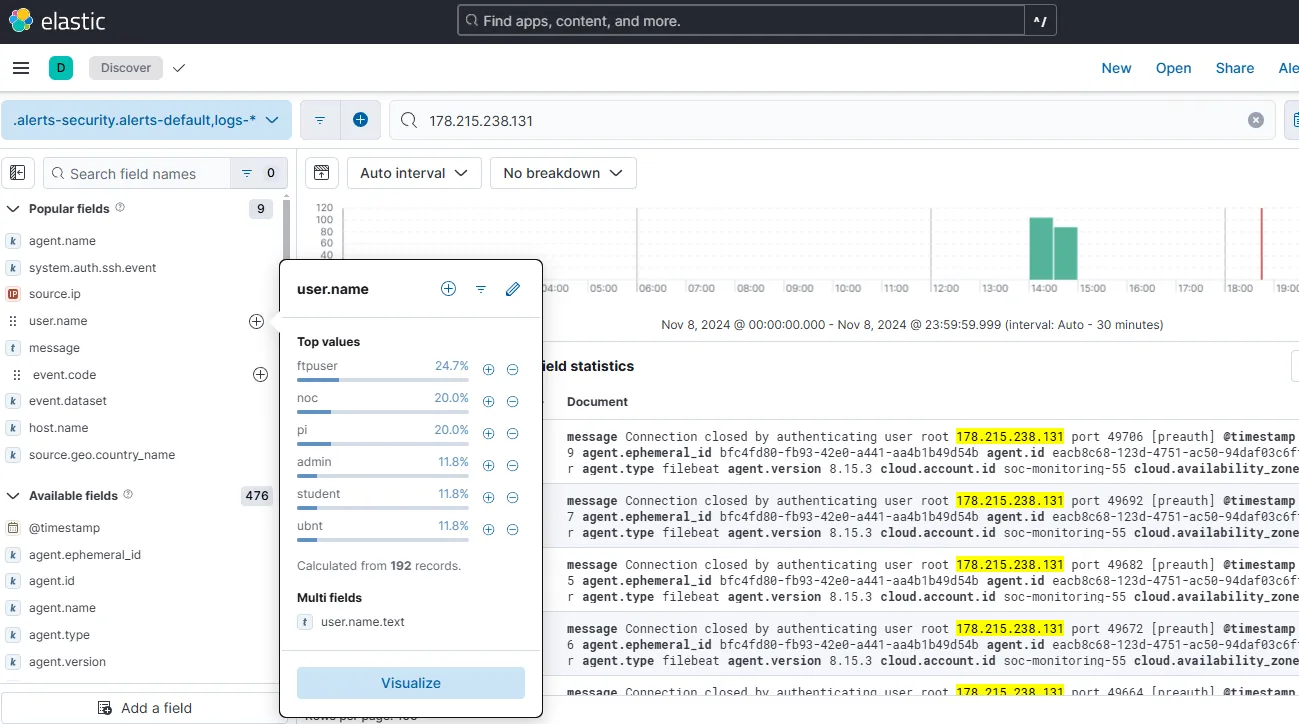
From 192 records involving this IP, I can see user.name field includes 6 usernames. They are: ftpuser, noc, pi, admin, student, and ubnt.
Any attempts successful?
For this step I can use the system.auth.ssh.event field.

None of the records contain an “Accepted” value. Meaning none of the attempts were successful.
Activity after login
In my case, since there is no successful logon, this is not applicable. However, if there were one, it would’ve be very important to found out what activity followed the successful login. An adversary could download a shell script, perform discovery commands, perform persistence, execute something malicious, run privilege escalation tools etc.
Create tickets from alerts
Let’s go to:
Under Security > Rules > Detection rules (SIEM)
Let’s select SSH Brute-force alert created earlier.
Edit rule settings > Actions > Webhook
Build the XML body
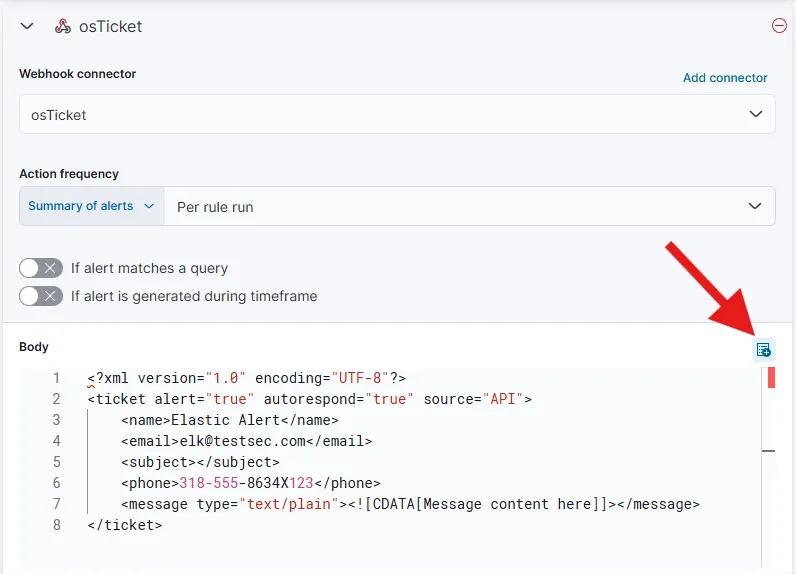
Using the add variable button, we can add variables to our message body to make it relevant. I am adding a few variables rule.name, rule.id, context.rule.description, rule.url, for context. The other rules and their usage can be referenced from here.
<?xml version="1.0" encoding="UTF-8"?><ticket alert="true" autorespond="true" source="API"> <name>Elastic Alert</name> <email>elk@testsec.com</email> <subject>{{rule.name}}</subject> <phone>318-555-8634X123</phone> <message type="text/plain"><![CDATA[Please investigate the rule: Rule name: {{rule.name}} Rule id: {{rule.id}} Description: {{context.rule.description}} Link: {{rule.url}}]]></message></ticket>For the {{rule.url}}, server.publicBaseUrl needs to be set.

On my ELK server kibana.yml file, I have set my server.publicBaseUrl to http://<elk-server-external-ip>:5601, which is the reference URL of our kibana instance. Let’s save the changes and restart the kibana service.
sudo systemctl restart kibana.serviceLet’s save the alert with the updated action item.
Any SSH Brute-force alerts that get generated from now on, should create a ticket containing basic details about the alert and the link to the alert right on the osTicket Agent Panel.