Alerts and Dashboards 4
Objective:
- Create an alert and dashboard based on the telemetry generated by Mythic
Build query for alert
From the ELK Web GUI
left-corner hamburger icon > Under analytics > Discover
Since I already know the filename of the payload (svchost-ucch45.exe), I am going to search for it with event.code: 1 (Process creation).
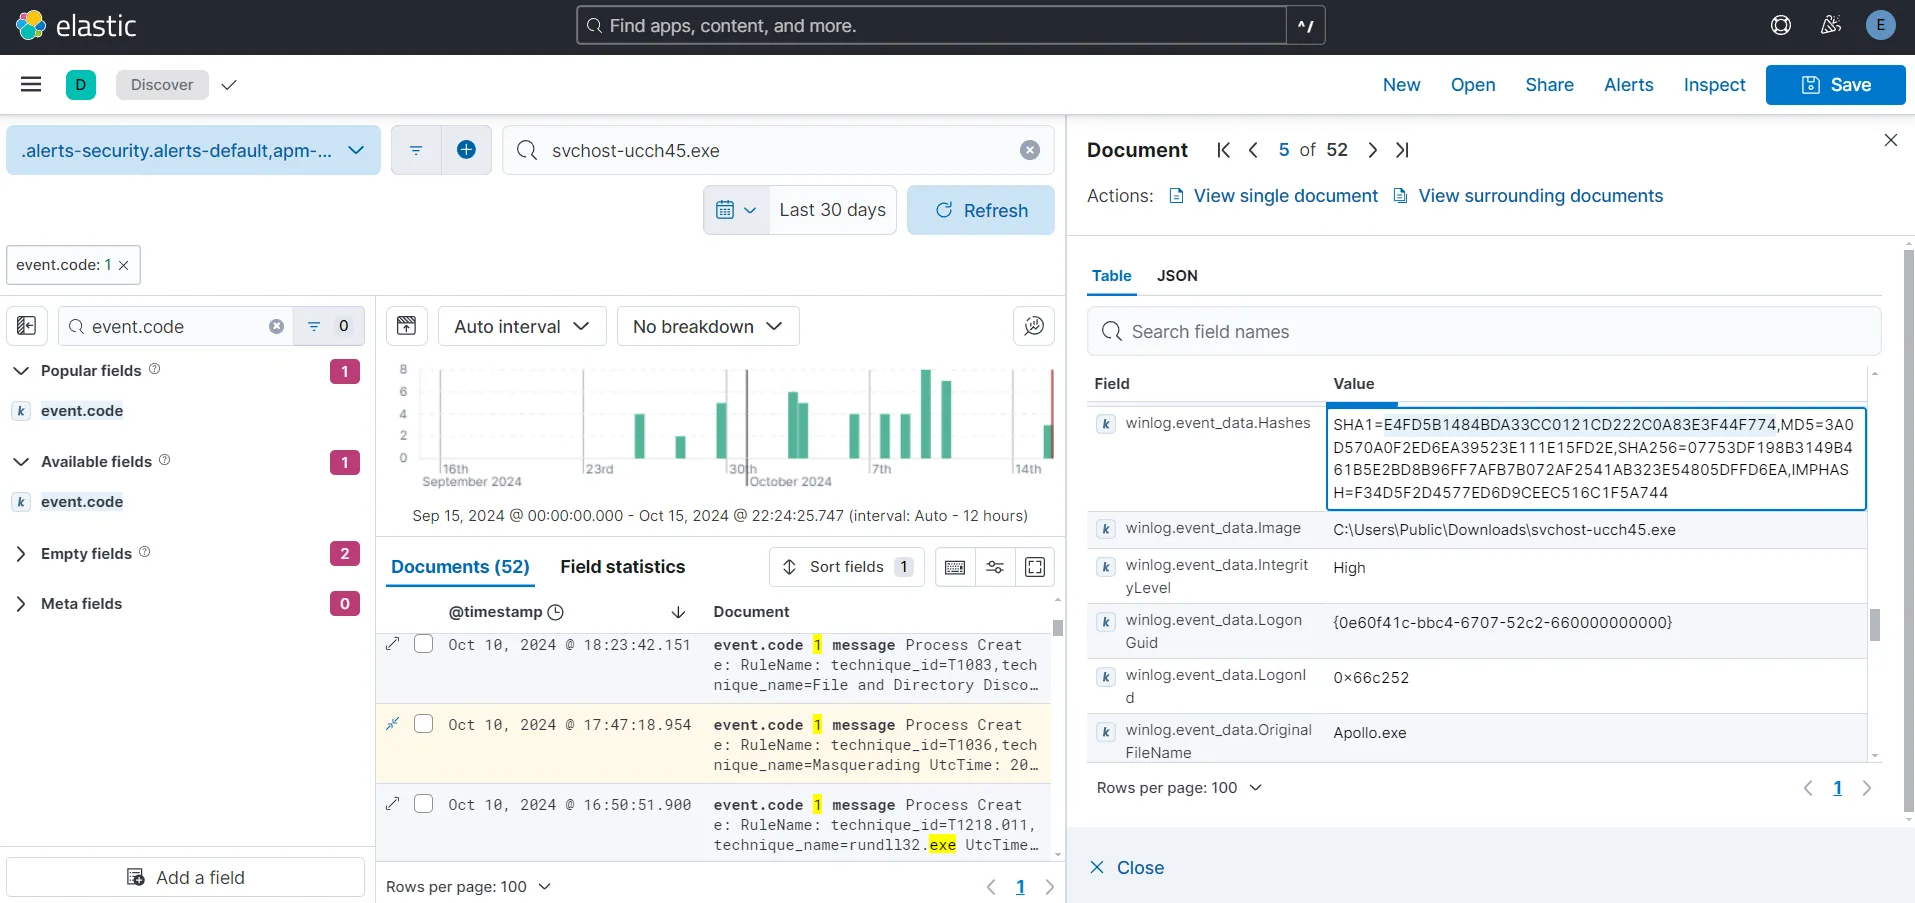
One interesting thing to note here is that while our service name is supposed to be svchost-ucch45.exe the field value of winlong.event_data.OriginalFileName is Apollo.exe. Let’s copy the SHA1 hash of the file and search for it in VirusTotal.
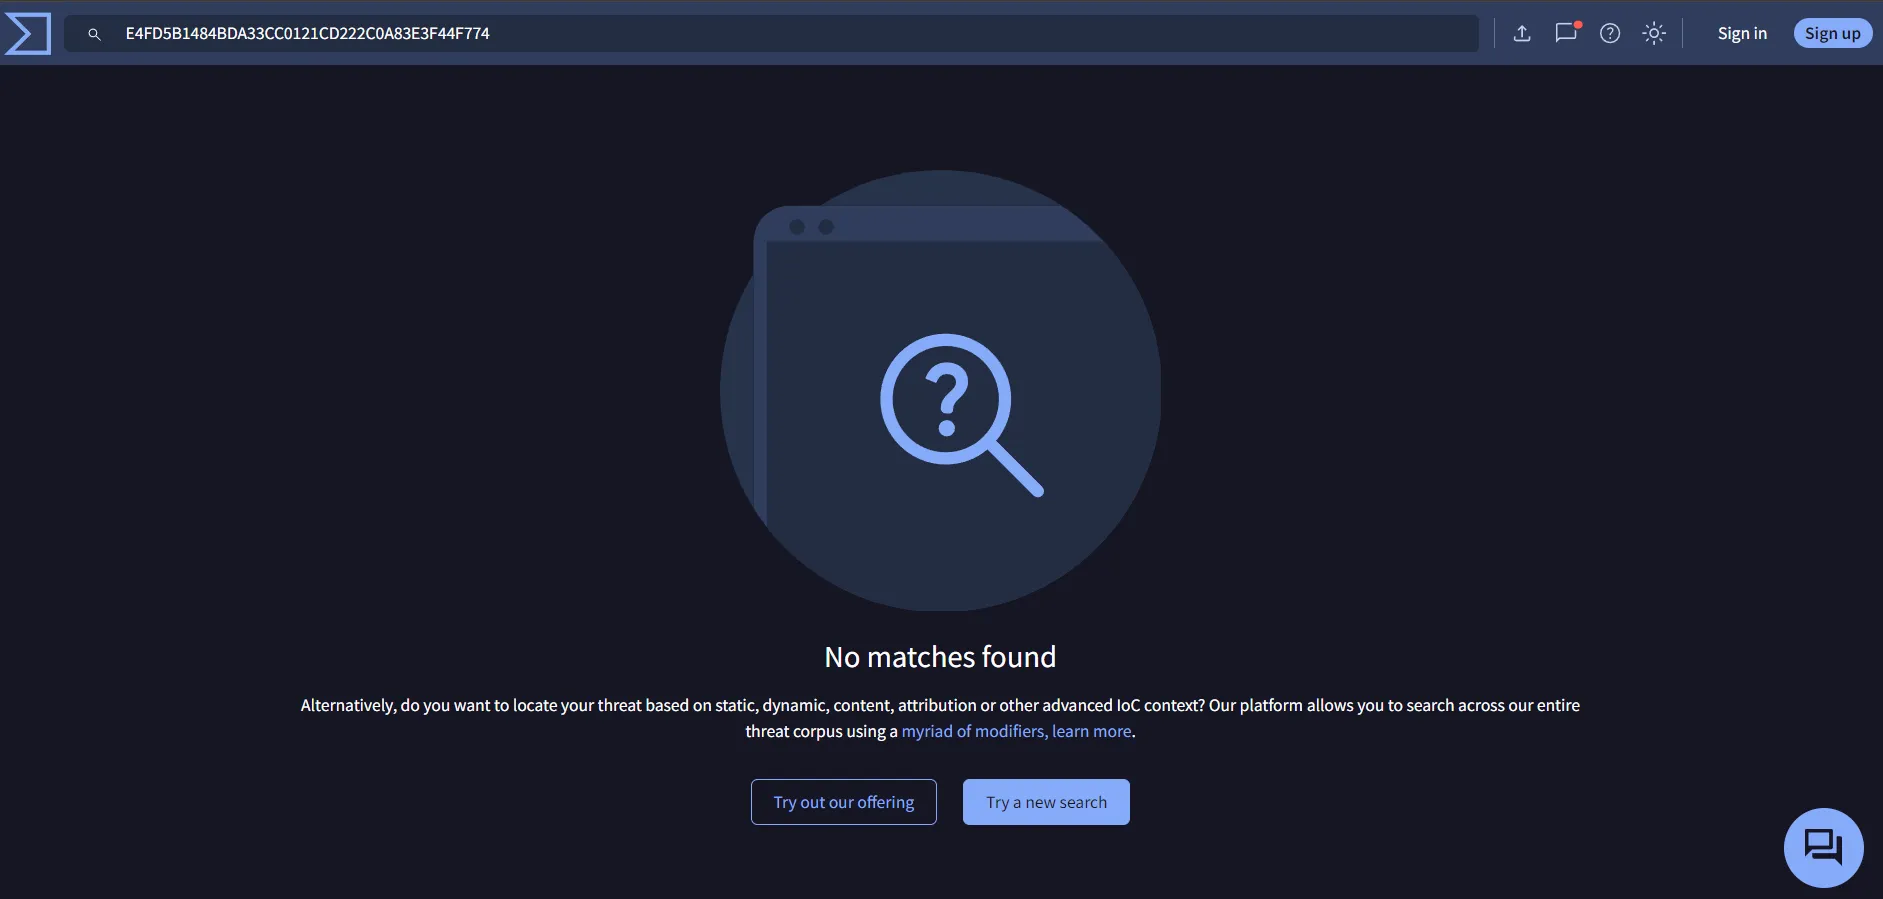
I am not able to find anything as it was a newly generated agent and hashes are quite trivial to change. However, it is always a good practice to do OSINT first.
I am going to create an alert to detect this kind of activity. The query shall include the OriginalFileName and the SHA256 hash. I am removing the svchost-ucch45.exe from the query as this searches for anything for any event which I don’t want. The query I am using is
event.code: "1" and (winlog.event_data.Hashes: *07753DF198B3149B461B5E2BD8B96FF7AFB7B072AF2541AB323E54805DFFD6EA* or winlog.event_data.OriginalFileName: "Apollo.exe")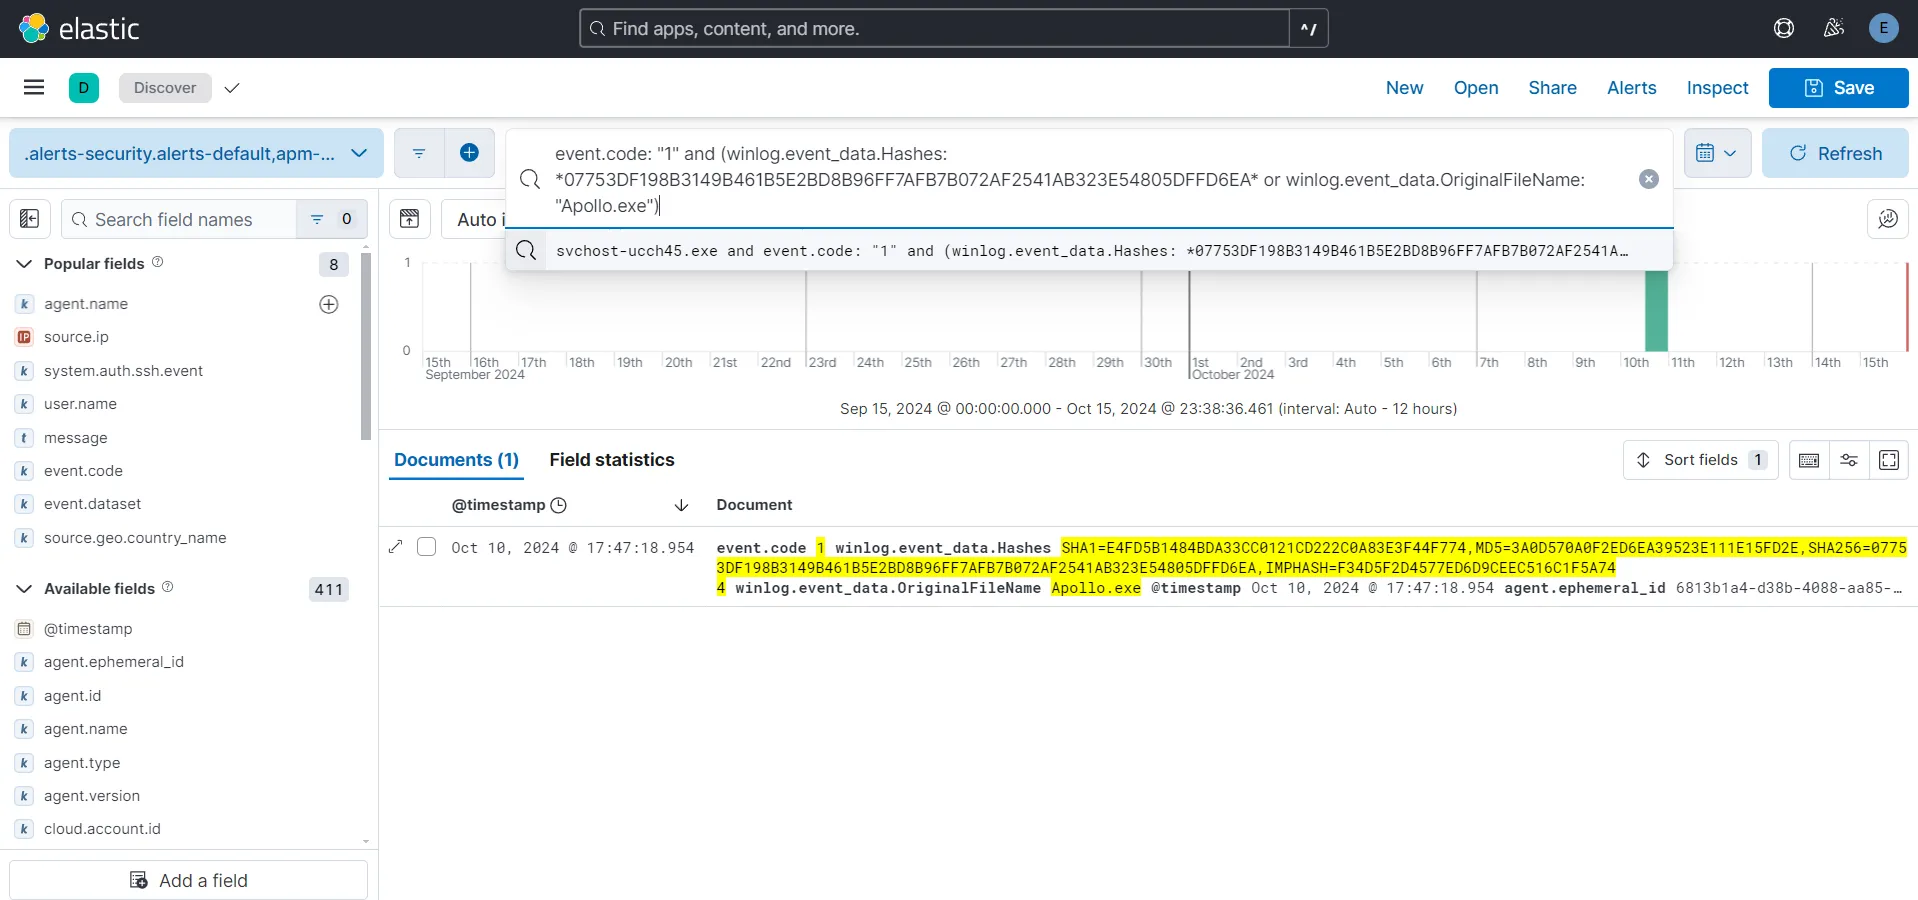
The output for me is now showing only one result for Process Create event which is correct. I am saving this search with name Mythic-Apollo-Process-Create.
Create Alert
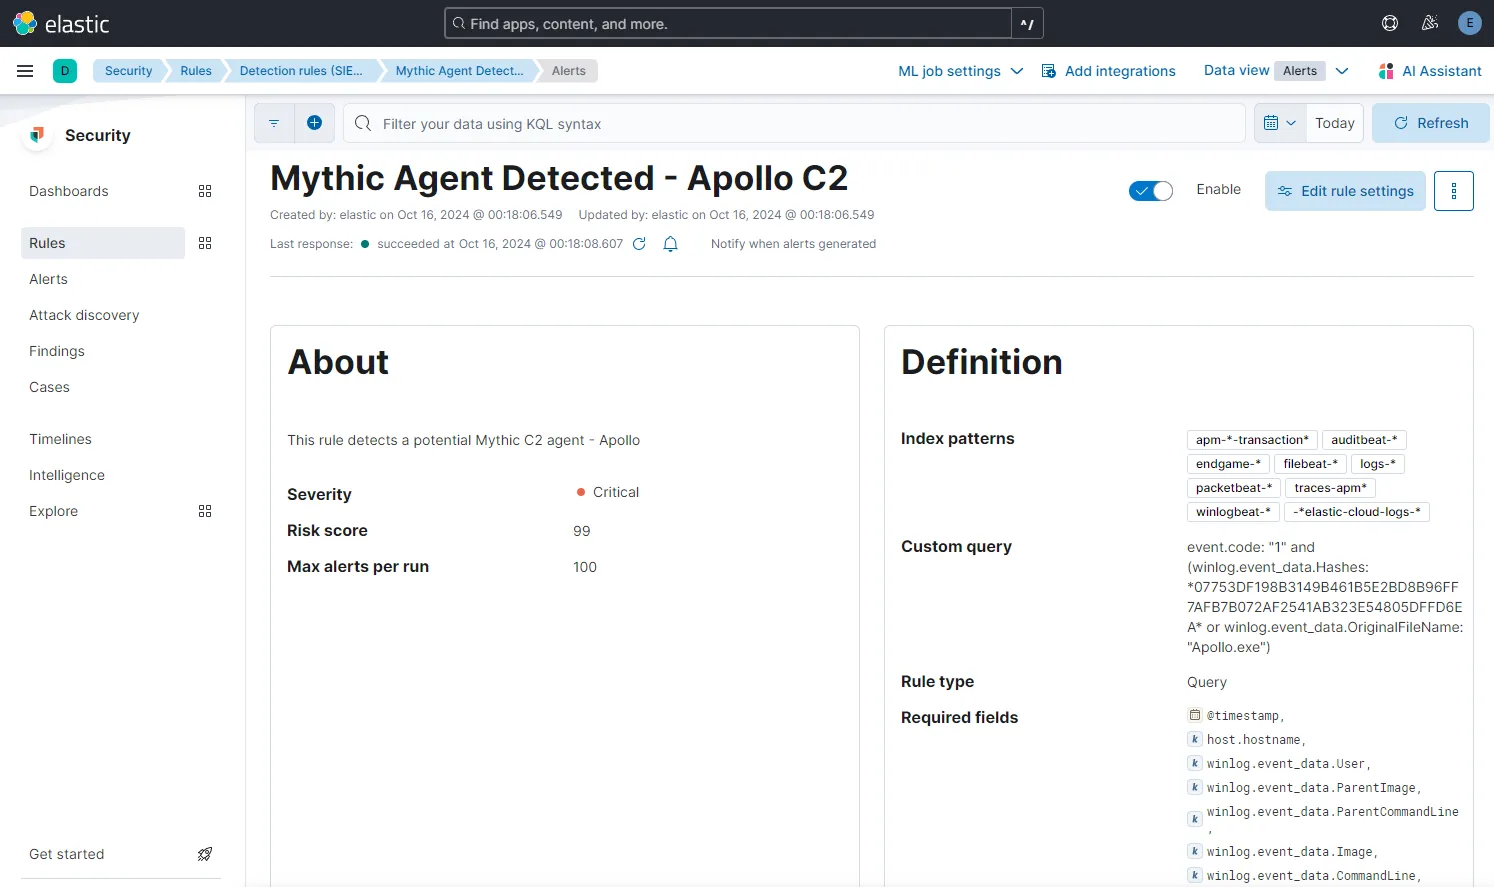
Under Security > Rules > Detection rules(SIEM) > Create new rule > Custom query
I want some fields to come up on my alert as they are pretty useful when an event happens. After observing my Process Creation event, it’s fields and their values, I am deciding to include the following fields:
- @timestamp
- host.hostname
- winlog.event_data.User
- winlog.event_data.ParentImage
- winlog.event_data.ParentCommandLine
- winlog.event_data.Image
- winlog.event_data.CommandLine
- winlog.event_data.ProcessGuid
- winlog.event_data.CurrentDirectory
Source > Index Patterns > Paste in the custom query > Add in the required fields > Continue
In the About rule section, let’s name the rule Mythic Agent Detected - Apollo C2 and add in a description. I am setting the severity as Critical. I am scheduling the rule to run every 5 minutes and also to look-back every 5 minutes. I am going to leave the Actions as it is for now and then Create and enable rule.
Build query for dashboard
This time, I want my dashboard to show suspicious activity to some extent. For the purposes of this project I am going to create queries for 3 types of suspicious events. Those being:
- Event ID 1 - Process Creation, (powershell, cmd, rundll32)
- Event ID 3 - Network Connections (External), any process creating an outbound network connection
- Event ID 5001 - Windows Defender disabled
After observing the events associated with the event IDs and the field values, I am including the following 3 working queries.
event.code: "1" and event.provider: "Microsoft-Windows-Sysmon" and (powershell or cmd or rundll32)event.code: "3" and event.provider: "Microsoft-Windows-Sysmon" and winlog.event_data.Initiated: "true"event.code: "5001" and event.provider: "Microsoft-Windows-Windows Defender"I have included rundll32 here because a lot of the malwares use this to load in a dll to perform nefarious activities.
Create Dashboard
Under Analytics > Dashboards > Create dashboards > Create visualization
I am going to create a nice table using each of these queries and add in the required field names. For each of the field names, I am re-assigning the Number of values as 999 and unchecked the Group remaining values as “Other” under Advanced. I am also renaming the table headings to shorten them.
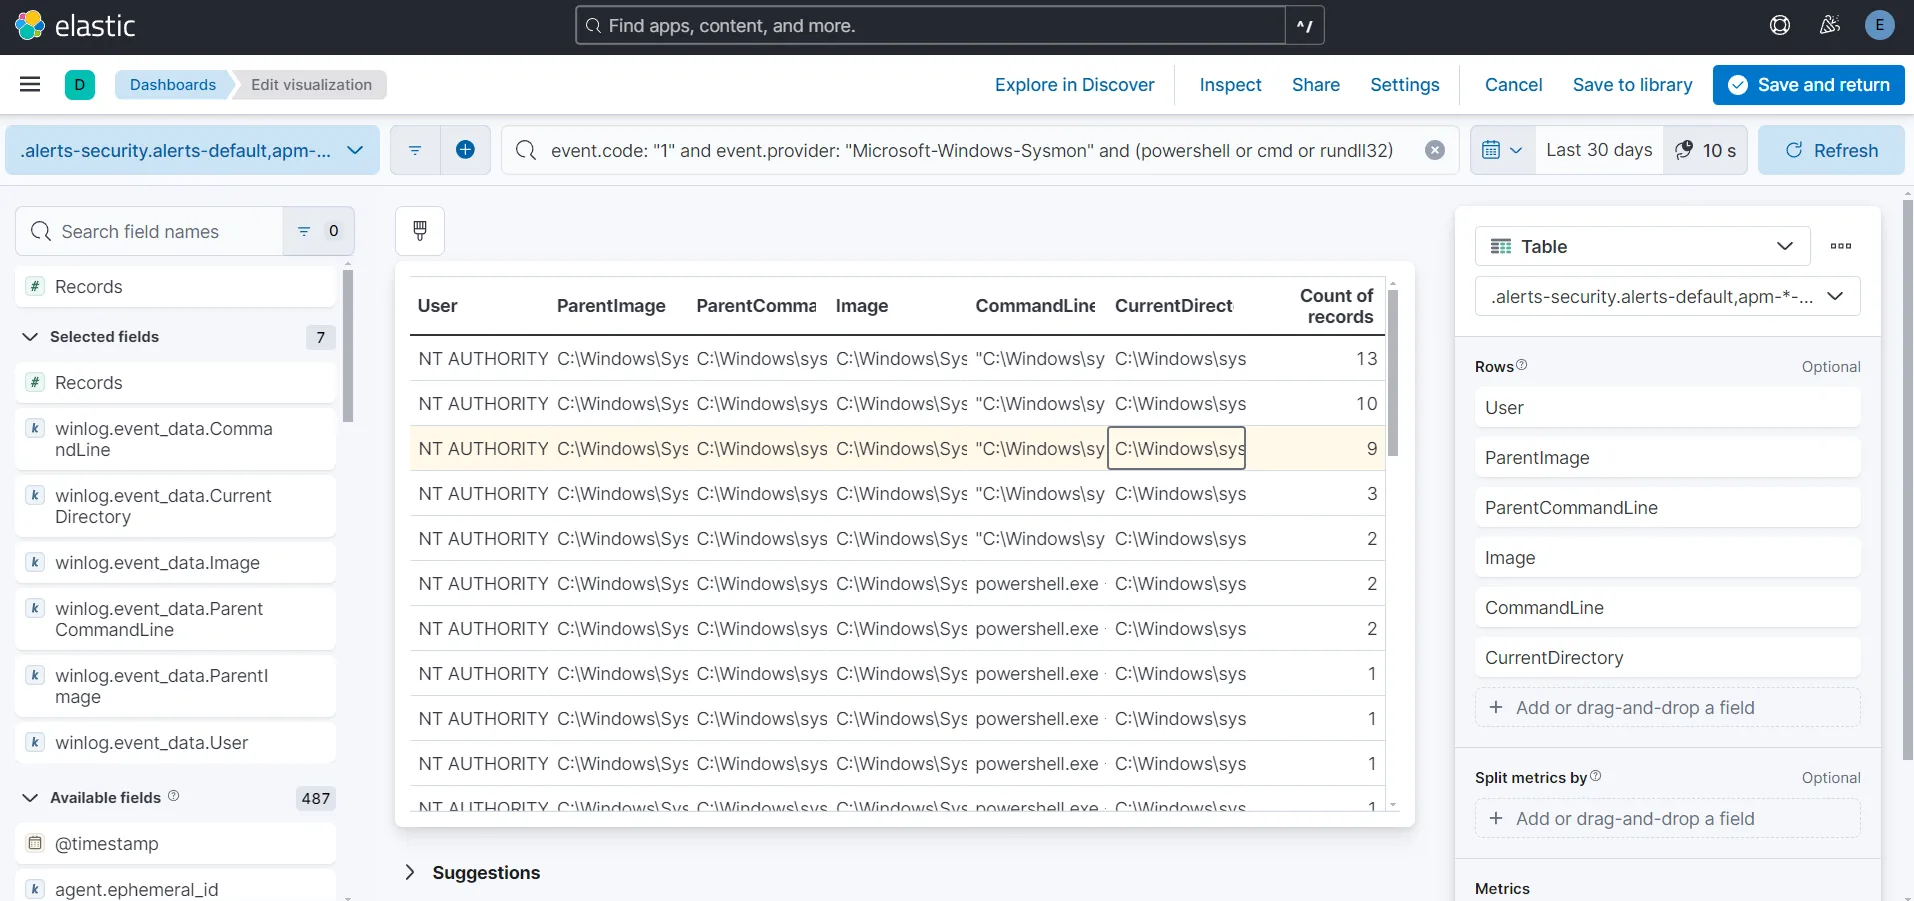
I am choosing the following fields to show on my tables.
For table including process creation Event ID 1:
- User
- ParentImage
- ParentCommandLine
- Image
- CommandLine
- CurrentDirectory
For table including external network connections Event ID 3:
- Image
- SourceIp
- DestinationIp
- DestinationPort
For Windows Defender disabled events Event ID 5001:
- hostname
- Product Name
- event.code
My dashboard is looking like this:
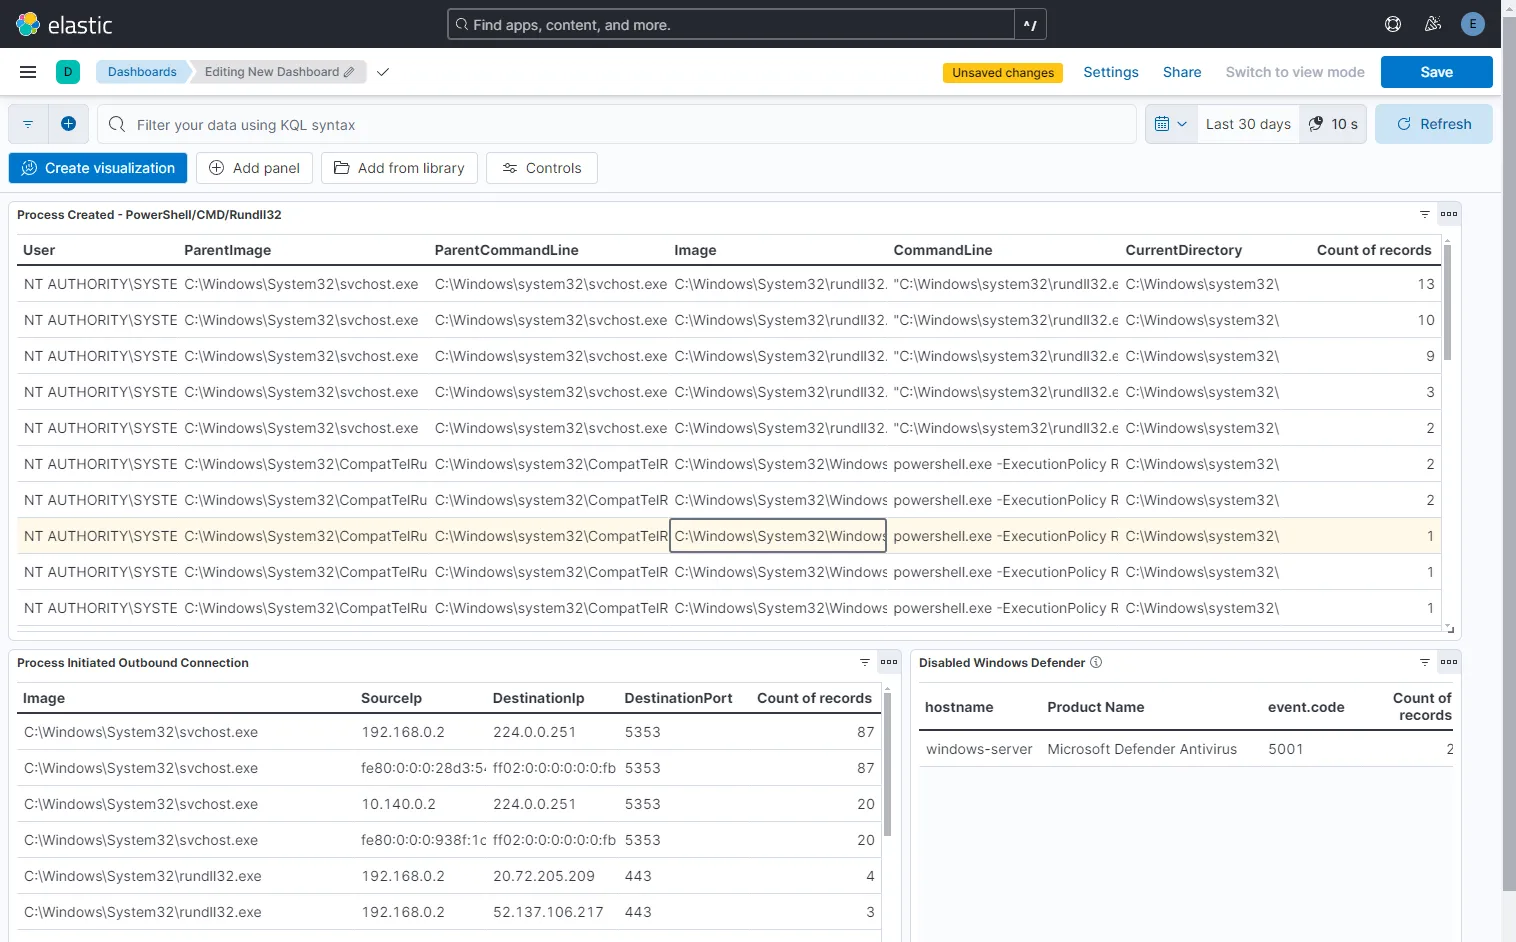
Lastly, let’s save the dashboard with name Suspicious-Activity.
From the table Process Created - PowerShell/CMD/Rundll32 and Process Initiated Outbound Connection, I am able to find my 1 record of svchost-ucch45.exe Image(suspicious service) running in CurrentDirectory as C:\Users\Public\Downloads\, which initiated outbound connection using C:\Program Files\PowerShell\7\pwsh.exe(PowerShell) to my mythic-server IP address at port 80.