Alerts and Dashboards 3
Objective:
- Create a dashboard for RDP activity
Create map for RDP failed
To create a dashboard for RDP activity, I am going to head over to
Analytics > Maps
and use query:
event.code: 4625 and agent.name: "windows-server"Add Layer > Choropleth
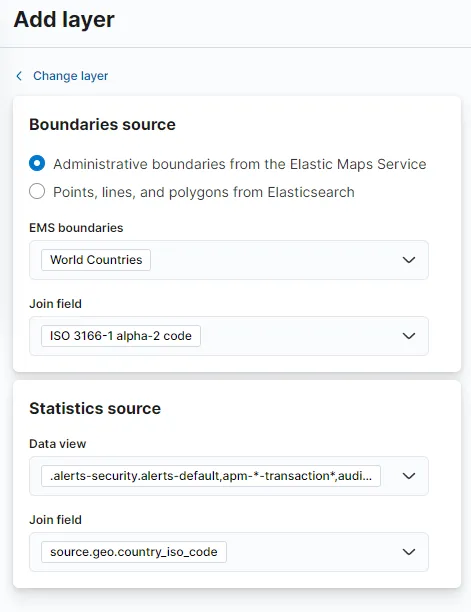
Add and continue > Leave the rest of layer settings as is > Save
I am saving my map with name Map - RDP auth failed and add to my existing dashboard Auth-Activity.
Create Map for RDP success
According to Ultimate Windows Security Event id 4624 is used for successful logins. I’ll also need the appropriate logon types (tells us how the user logged in).
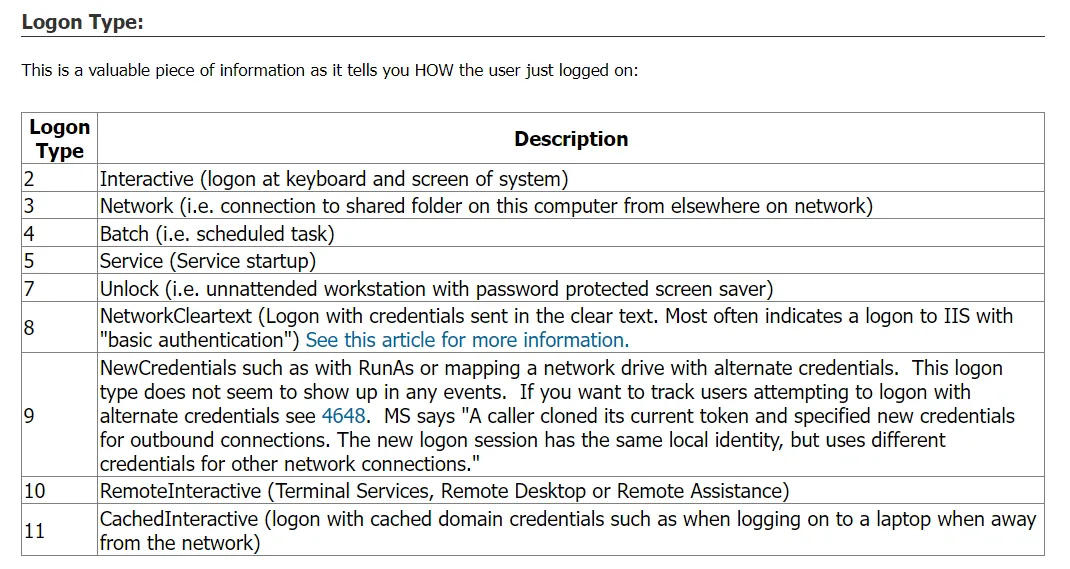
We can see that Logon Type 7 and Logon Type 10 are the types of logons we should be filtering out. The LogonType field is under winlog.event_data.LogonType field for all the winlog records. I choose my machine, select fields source.ip and user.name, and use the following query
event.code: 4624 and (winlog.event_data.LogonType: "7" or winlog.event_data.LogonType: "10")I have saved my search as RDP success for me to use later. I am also duplicating the existing Map - RDP auth failed and pasting in the query and also naming it Map - RDP auth success.
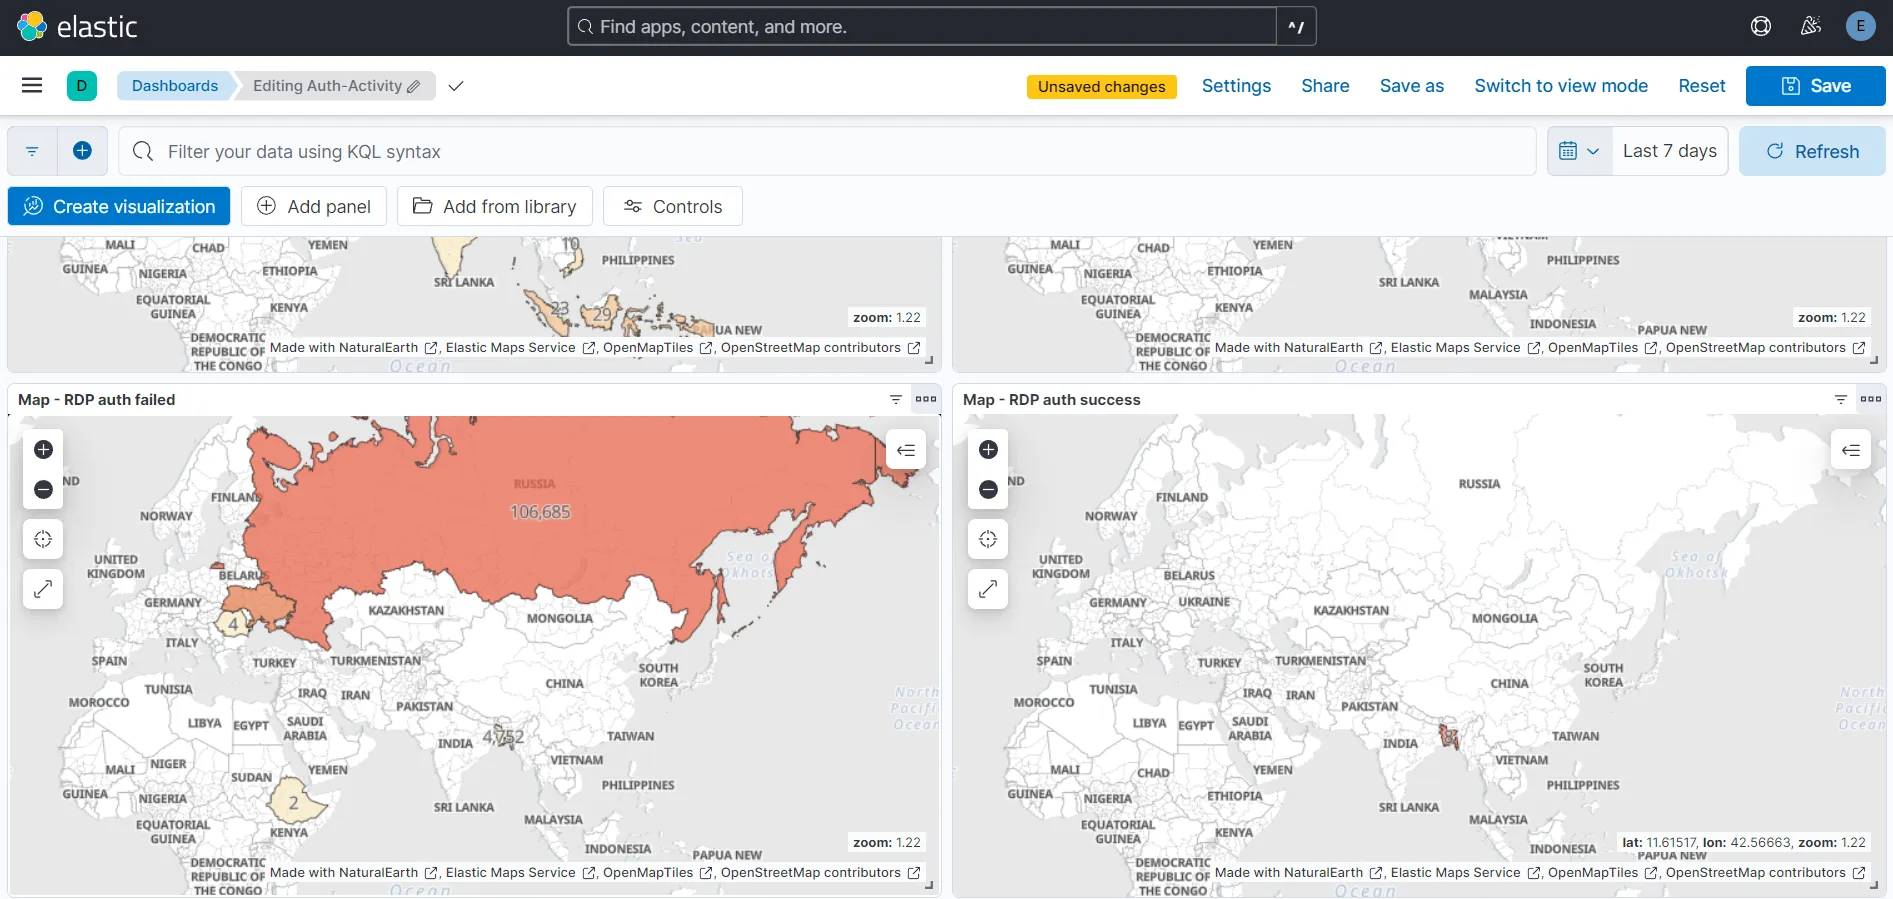
I am able to see 106,685 RDP failed attempts from Russia and 8 RDP success attempts from Bangladesh(logged on my me) on my Auth-Activity dashboard.
Create Tables
I would also like to see the Source IPs, Usernames along with the country names directly on my dashboard. To do this:
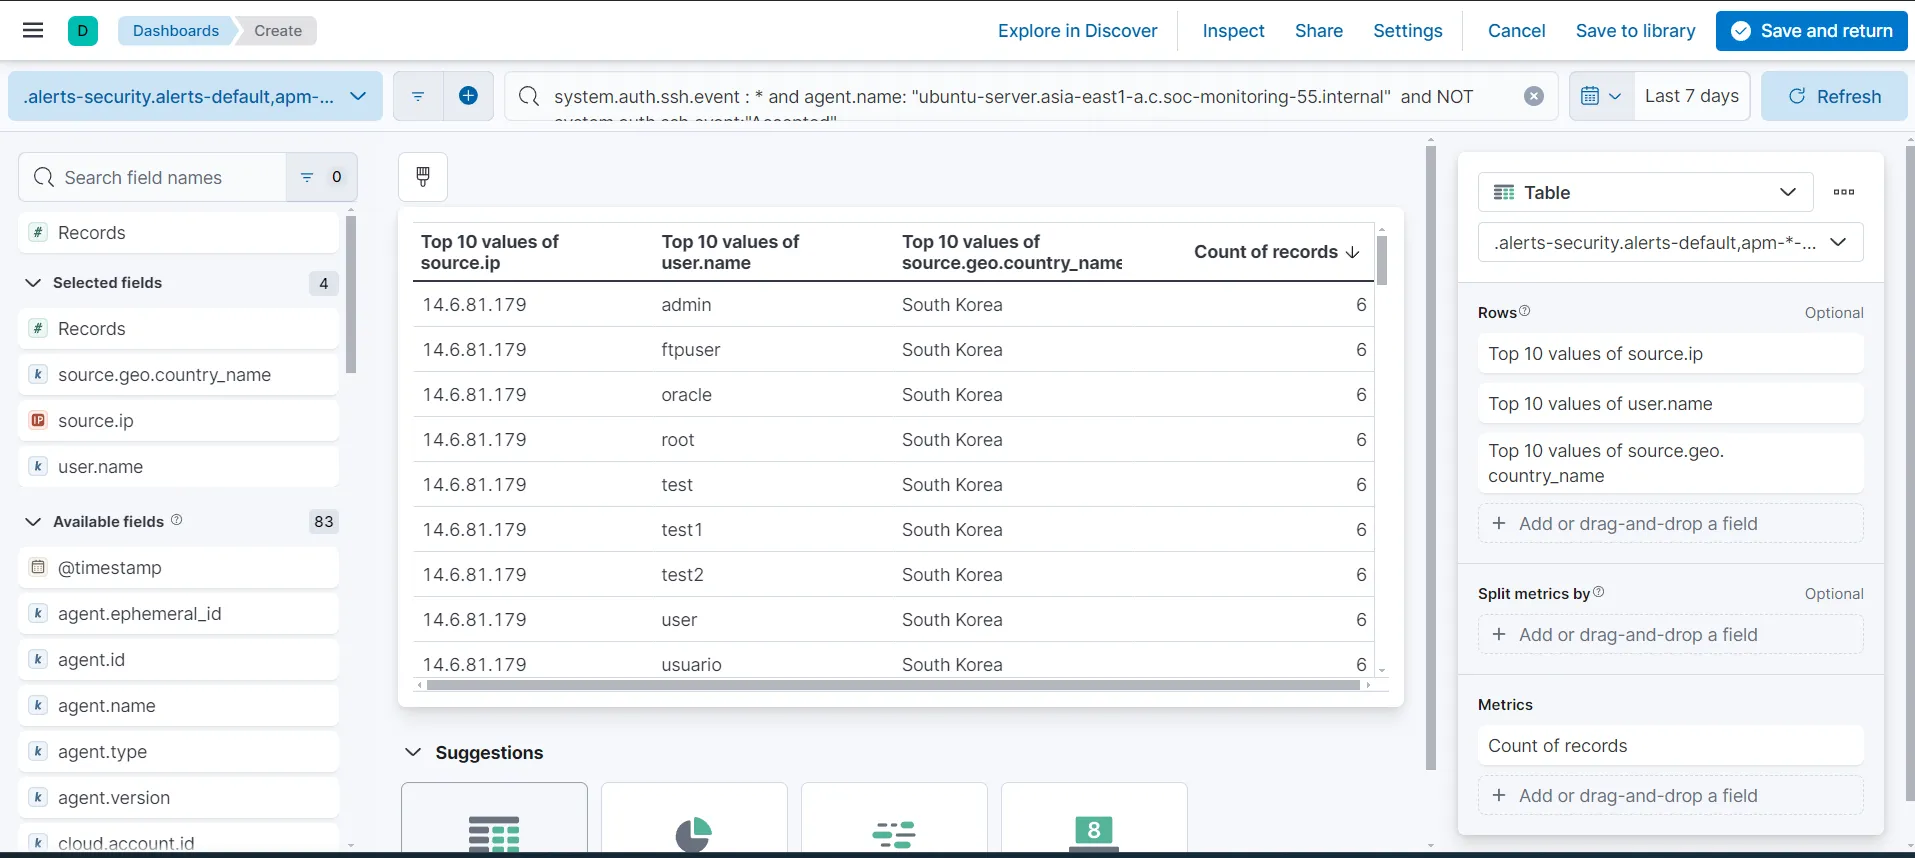
From the dashboard > Create visualization
I am using the queries I had used earlier to filter the failed and successful logins. While setting up the rows, I made sure to uncheck the Group remaining values as “Other”. Keeping this checked might show “Other” in the field values instead of showing us the actual information. I am also setting the Count of records field to descending.
My setting for the Table - SSH auth unsuccessful is looking like this:
My dashboard
Finally, my dashboard now looks like:
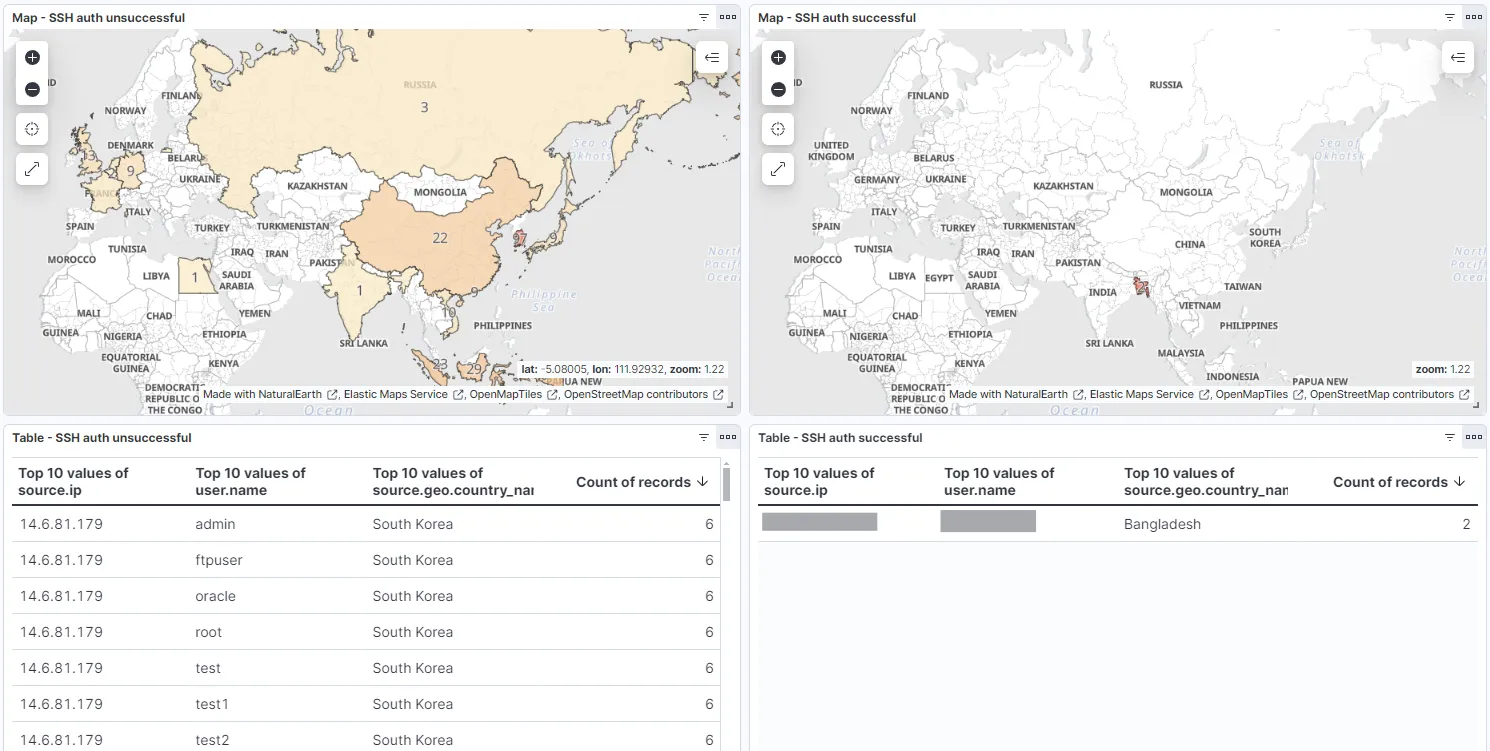
For SSH attempts:
For RDP attempts:
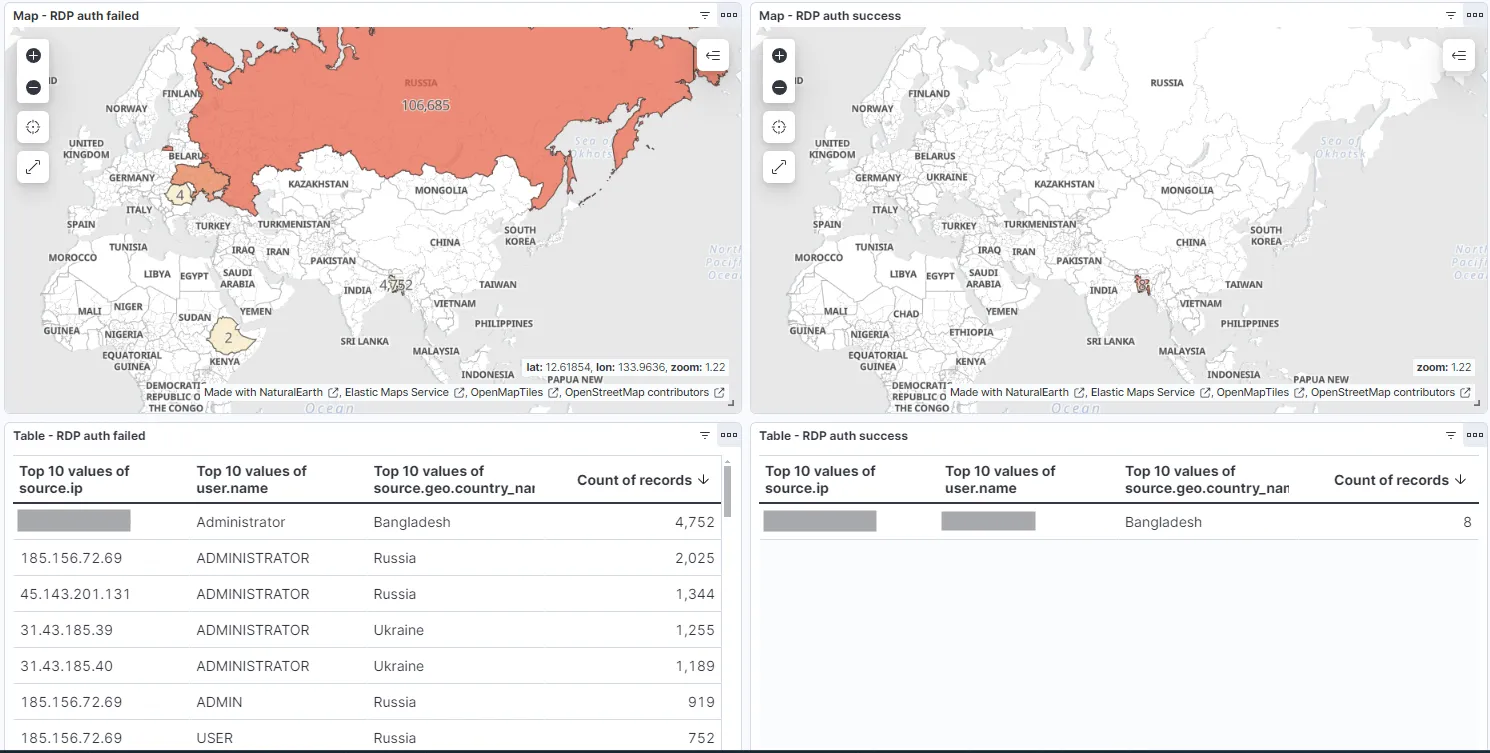
I can observe from this dashboard the login status of our Ubuntu and Windows machines. I am able to see the source IPs of the attackers or the successful logins made along with what usernames were used, where the IP belongs from, and the number of times they have tried to login.
Let’s save the dashboard.