Alerts and Dashboards 1
Objective:
- Create SSH Brute Force alert and dashboard
Data is being ingested from our Ubuntu machine into our elasticsearch instance. To create an alert for brute force activities, we first need to query our logs. Our sources of interests shall be the SSH attempts made, the username used, and the source IPs.
Filter for unsuccessful SSH attempts
From the Discover tab of our Elastic GUI, I’ll start by filtering for agent.name with our Ubuntu machine from 180,490 collected logs.
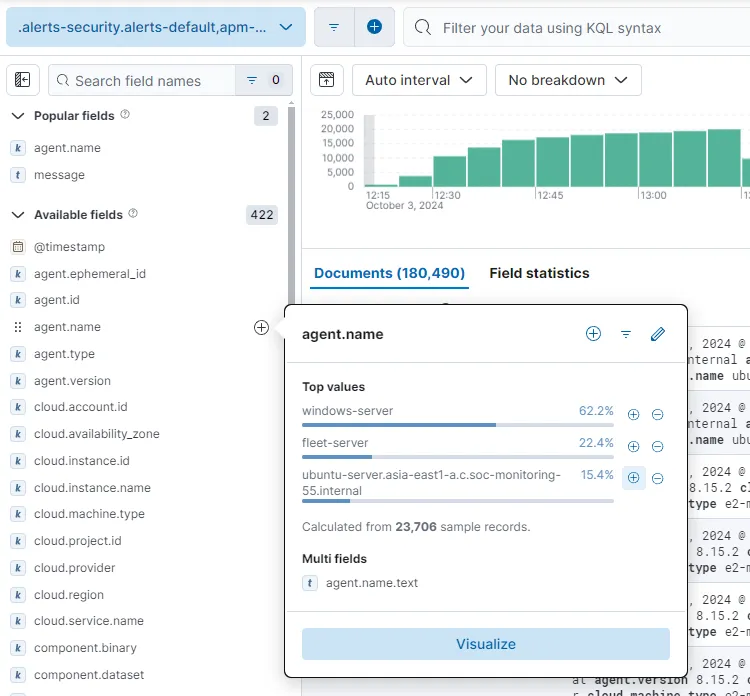
After observing the field names for a while, the system.auth.ssh.event field looks promising. Let’s add that to our filter.
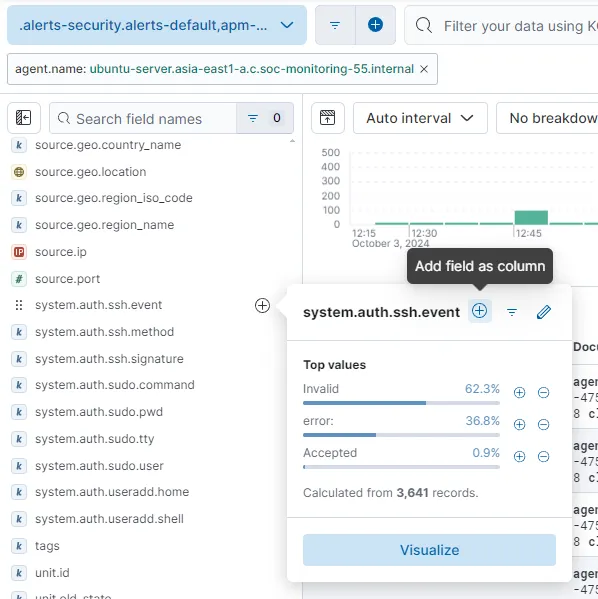
To omit logs that do not contain any value for system.auth.ssh.event, I’ll be adding a filter system.auth.ssh.event : * to search for data within the field to exist in any form.
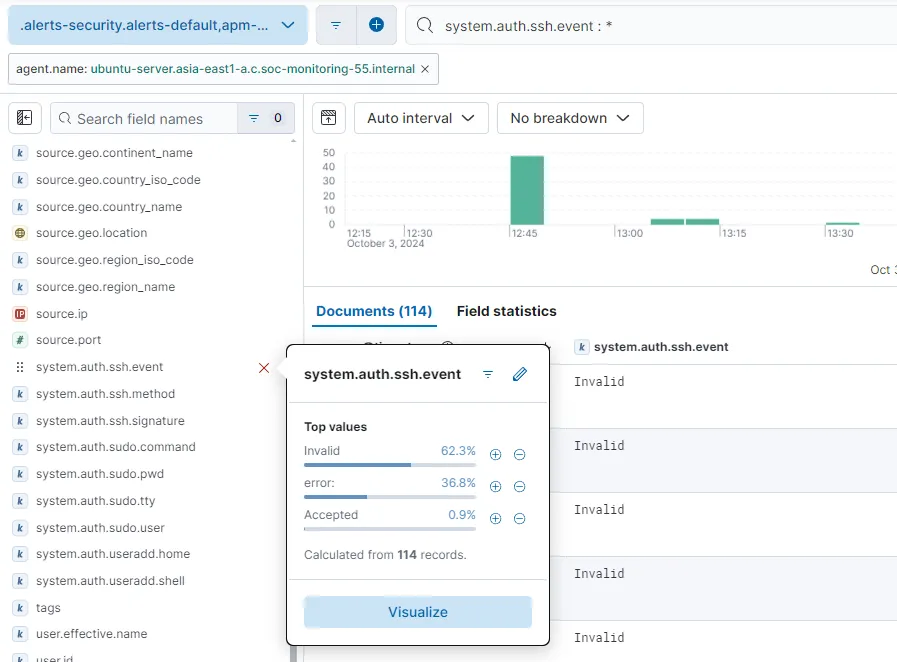
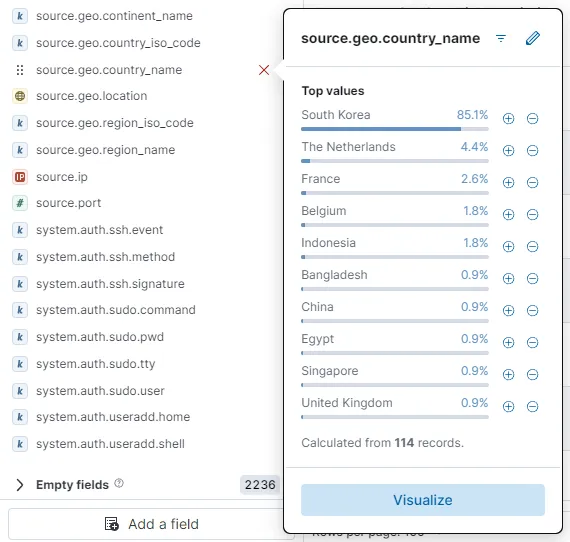
Now we have 114 events filtered (lot less than before). Invalid, error and Accepted are three types of values that the field has.
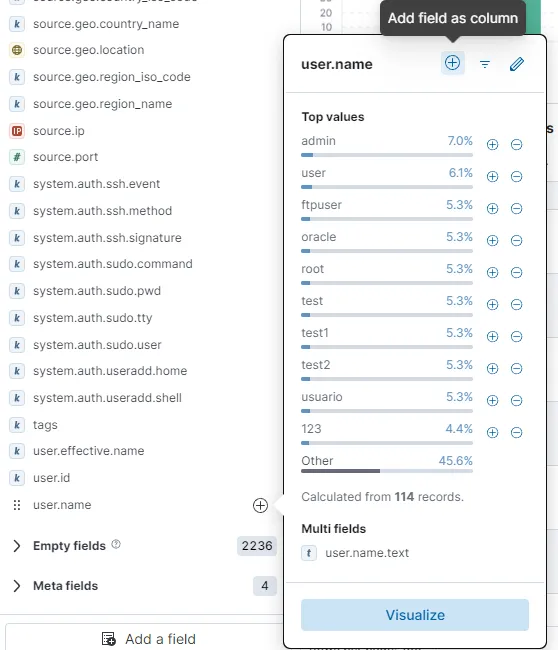
I can also see a lot of interesting usernames attempted. I am going add the user.name field as well. I’ll also be adding source.ip and source.geo.country_name fields as well. In my case, a lot of these brute force attempts was from South Korea.
I am going to exclude the Accepted system.auth.ssh.event values so that I am only shown the failed SSH attempts from various sources. The upper-right corner has save button to save the search. I am going to save this filtered search as SSH unsuccessful without including the time.
Create alert rule
Now let’s go to
Alerts > Create search threshold rule
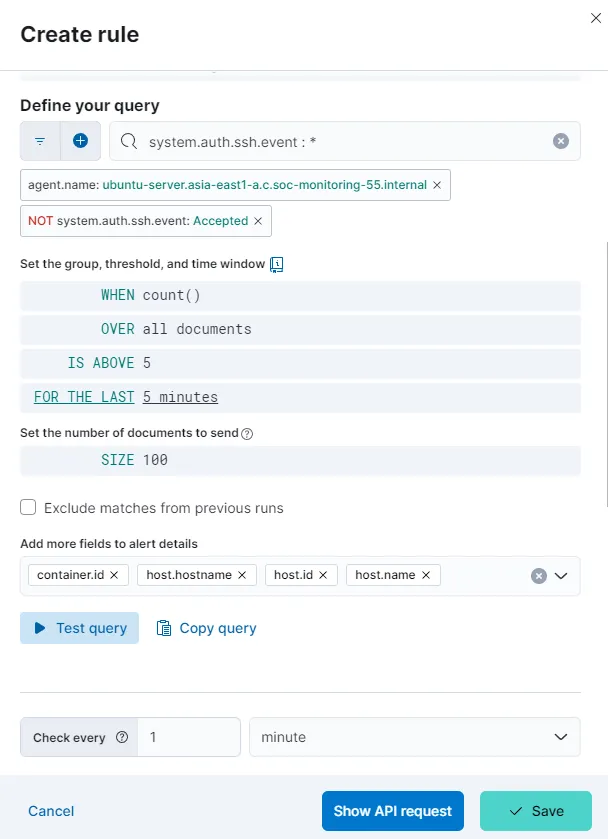
I have set the alert to check for more than 5 entries in the last 5 minutes and to check for the same for every minute. Let’s save the rule for now without any actions.
Create Dashboard
Let’s head over to Maps.
upper-left corner hamburger menu icon > Analytics > Maps
I’ll combine the filters from my saved search SSH unsuccessful and use it to filter events on Maps.
system.auth.ssh.event : * and agent.name: "ubuntu-server.asia-east1-a.c.soc-monitoring-55.internal" and NOT system.auth.ssh.event:"Accepted"Let’s add a layer. I’m choosing Choropleth.
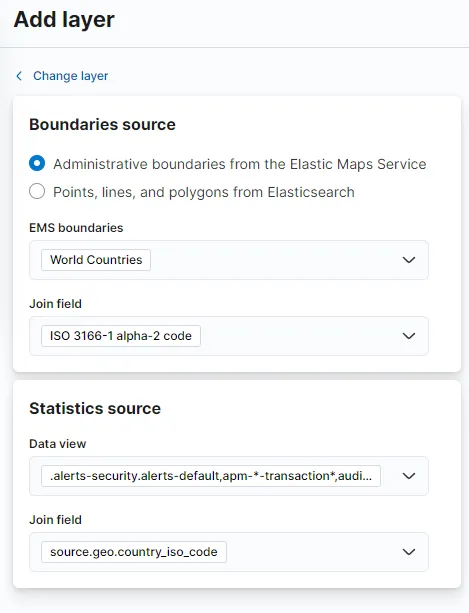
For the Join field value under Statistics source, we’ll need to choose country_iso_code as country_name will not match the selected Join field on the Boundaries source. I am keeping the rest of layer settings as it is and save the Map as Map - SSH auth unsuccessful and add it to a new dashboard. Let’s save the dashboard as well with name Auth-Activity.
I am adding another Map to this dashboard for the Accepted attempts. I’ll duplicate the existing map and edit the map to filter for only “Accepted” SSH attempts. For this I’m changing the query to
system.auth.ssh.event : * and agent.name: "ubuntu-server.asia-east1-a.c.soc-monitoring-55.internal" and system.auth.ssh.event:"Accepted"Let’s also change the name to Map - SSH auth successful.
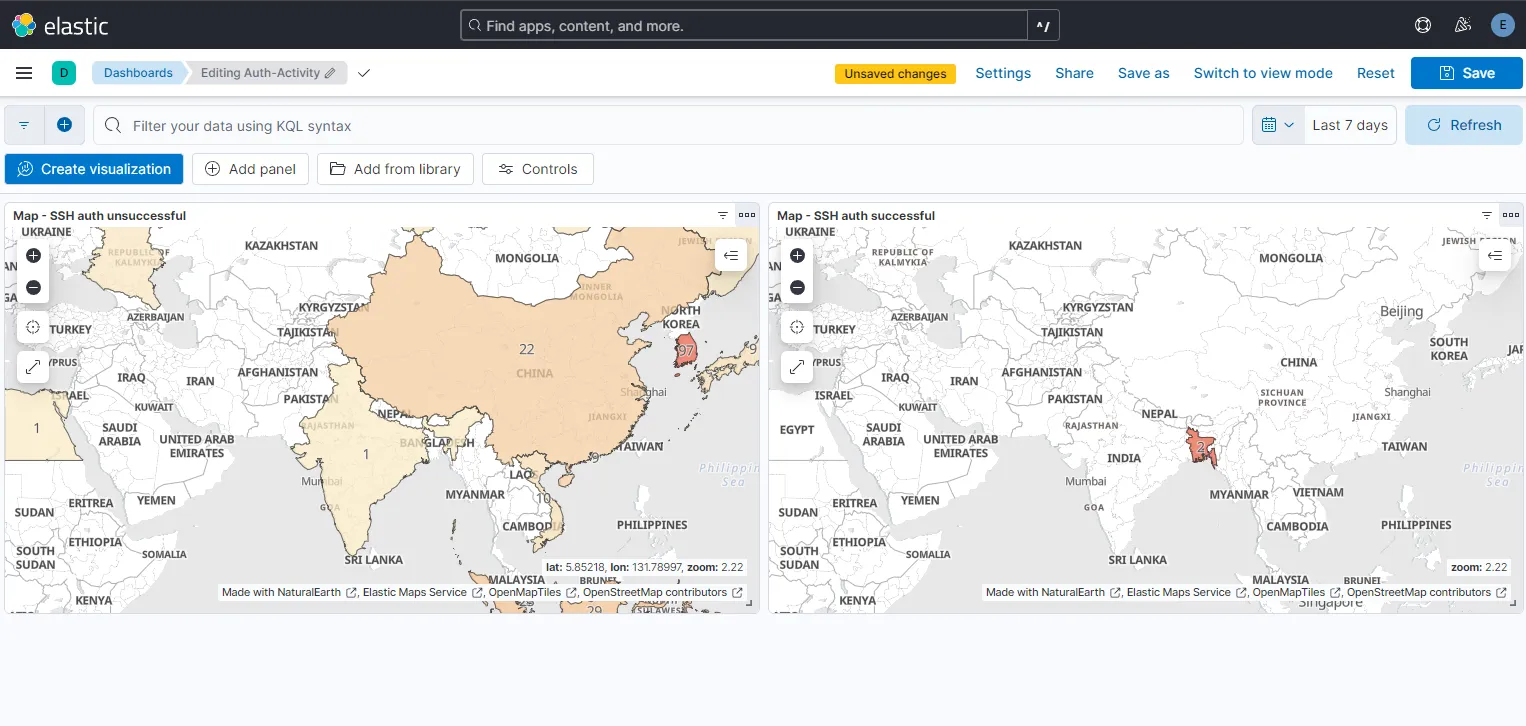
With all the changes saved to the dashboard, I have now this dashboard with two maps indicating the unsuccessful and successful SSH login attempts. Here, for the last 7 days, I am observing 97 failed attempts from South Korea, a high number of attempts as seen before and 2 successful logins from Bangladesh which were attempted by me.
From now on, we’ll be alerted whenever unsuccessful activities occur. We can also view the info on our created dashboard.